


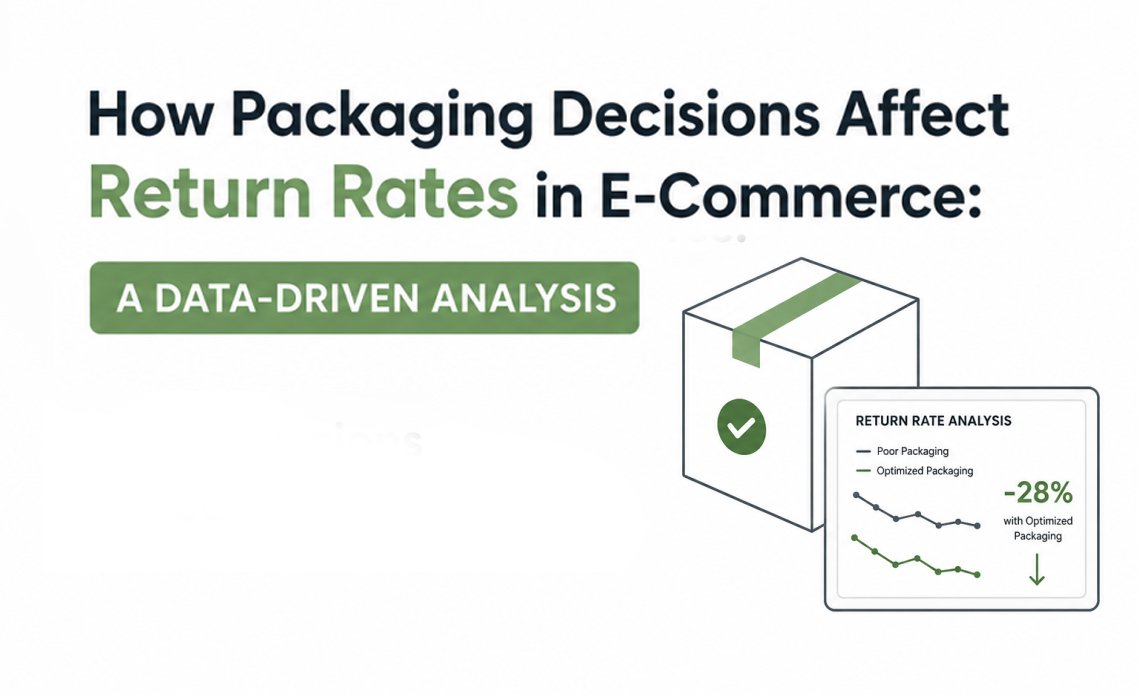
Return rates in e-commerce are tracked obsessively as a business performance metric and analyzed infrequently as a packaging problem. The standard framework for reducing returns focuses on product quality, sizing accuracy, photography truthfulness, and customer expectation management, all legitimate levers with genuine impact. What this framework consistently underweights is the packaging variable, specifically how decisions made about box construction, protective cushioning, presentation quality, and packaging communication affect return rates independently of whether the product itself was right for the customer.
The data connecting packaging decisions to return rates is less consolidated than the data connecting product quality to returns, partly because packaging-attributed returns are harder to categorize accurately in return management systems that ask customers to select from predefined return reasons. A customer who receives a product that arrived damaged selects damaged item from the return reason dropdown. A customer who receives a product that arrived undamaged but whose packaging created a quality perception mismatch with the price paid may select not as described or didn’t meet expectations, obscuring the packaging attribution. A customer who receives a product in excellent condition but whose packaging communication created false expectations about what was inside may attribute their dissatisfaction to the product rather than to the packaging that misrepresented it. These attribution challenges mean return rate data systematically underreports packaging’s contribution to returns, which means the real effect is larger than the data directly shows.
How Much Do Damaged Goods Returns Actually Cost?
Damage-related returns represent the most directly attributable packaging-caused return category, and their cost extends considerably beyond the product replacement value that most e-commerce return analyses calculate.
The direct cost components of a single damage-related return include the original shipping cost, the return shipping cost where the seller covers it, the product replacement or refund cost, and the handling cost of processing the return when it arrives. Narvar’s 2023 consumer returns research puts the average cost to process a single e-commerce return at between 21 and 33 dollars in operational costs before the product value is counted. For a thirty-dollar product, a single return can represent a total cost exceeding the original sale value.
The indirect cost components are harder to measure but meaningful in aggregate. A customer who receives a damaged product and returns it has a measurably lower probability of repurchasing from the same retailer than a customer who received the same product undamaged. Salesforce research on customer experience and purchase behaviour found that 57 percent of consumers stop buying from a company after one or two negative experiences. A damaged shipment is a negative experience, and its probability of terminating a customer relationship is considerably higher than data on individual return transactions reveals.
Inventory recovery value from damaged returns is consistently lower than the original product cost. Products that return in damaged condition are graded, assessed, and either refurbished, discounted for resale through secondary channels, or disposed of. The recovery value typically falls between 10 and 50 percent of original product value depending on product category and damage severity. The packaging decision that allowed the damage to occur destroyed the difference between recovery value and original product value, a destruction that the initial packaging cost comparison with a more protective alternative should have prevented.
What Research Says About the Relationship Between Packaging and Damage Rate
The relationship between packaging specification and damage rate during e-commerce fulfilment has been studied with enough rigour to produce data that packaging decision-makers can use as a practical reference.
ISTA testing research, which subjects packaged products to simulated distribution conditions including drops, vibration, and compression, consistently shows that packaging specifications designed around minimum product protection rather than distribution stress realities produce higher field damage rates than specifications designed around realistic worst-case distribution conditions. The gap between minimum protection and realistic protection is where damage-related returns accumulate, and the cost of closing that gap through better packaging specification is almost always lower than the cumulative cost of the additional returns it prevents.
FedEx and UPS damage claim data, which is tracked at commodity level, shows that electronics, fragile household goods, and glass products account for disproportionate damage claim volumes relative to their share of total e-commerce shipments. The damage rate difference between these high-risk categories and lower-risk categories is not solely a product fragility effect. Packaging specification for these categories varies considerably across sellers, and sellers using specifications that underestimate the stresses of parcel distribution generate higher damage rates than sellers using specifications developed against realistic distribution testing.
Amazon’s Frustration-Free Packaging programme data provides a partial window into the packaging-returns relationship because FFP-certified packaging is designed specifically to survive the Amazon distribution environment, and Amazon tracks return rates by packaging type. While Amazon doesn’t publish this data publicly, the economic incentive structure of the FFP programme, which offers sellers cost benefits in exchange for FFP compliance, reflects Amazon’s internal understanding that packaging specification affects distribution damage rates at scale.
How Unboxing Experience Affects Return Rates Beyond Damage
The connection between unboxing experience and return rates operates through a mechanism that damage-focused analysis doesn’t capture: the expectation confirmation or violation that occurs when a customer opens a package and assesses whether what they received matches what they believed they were purchasing.
Research from Dotcom Distribution’s 2022 e-commerce report found that 40 percent of consumers who described their most recent online purchase packaging as exciting or premium said they would definitely buy from that retailer again, compared to 29 percent of consumers describing their packaging as average. This 11-percentage-point repurchase rate difference translates into lower effective return rates because customers who form stronger positive impressions at unboxing are less likely to rationalise a return around minor dissatisfaction that a weaker initial impression would amplify.
The expectation confirmation mechanism works in both directions. Premium packaging creates an expectation of quality that the product then has the opportunity to confirm, creating a positive emotional context that makes customers more forgiving of minor product imperfections. Inadequate packaging creates a quality concern before the product is even assessed, putting the product in the position of needing to overcome a negative first impression. A consumer who opens a premium product to find it wrapped in a single layer of tissue paper in an undersized box has already begun doubting their purchase before examining the product itself.
This expectation mechanism is particularly acute in product categories where the purchase decision was made online based on product photography and description rather than physical handling. Jewellery, cosmetics, premium food, and luxury goods are categories where the product at unboxing is being compared against a mental model formed from digital content rather than tactile experience, and the packaging’s role in either validating or contradicting that mental model significantly affects whether the customer decides the product was worth the purchase.
What Specific Packaging Decisions Produce Measurable Return Rate Differences
Several specific packaging decisions produce demonstrable return rate effects that e-commerce research has quantified with sufficient consistency to be operationally relevant.
Void fill adequacy is the packaging decision with the most direct connection to damage-related return rates. Products packed with insufficient void fill to prevent movement within the outer box during shipping experience impact forces proportional to the distance they can travel before contacting the box wall. ISTA simulation testing shows that products with adequate void fill preventing more than half an inch of movement in any direction experience dramatically lower simulated damage rates than products with sufficient void fill to prevent movement of two inches or more. Void fill is also among the lower-cost packaging line items per unit, making the cost-return rate calculation for adequate void fill almost universally favourable.
Box sizing relative to product dimensions affects both damage rates and a separate return driver: perceived value. An oversized box creates excessive void space that increases shipping cost through dimensional weight pricing, communicates poor packaging judgement to the customer at unboxing, and requires more void fill to adequately protect the product than a correctly sized box would need. Research from packaging optimisation programmes at multiple e-commerce brands consistently shows that right-sizing box dimensions to product dimensions, rather than using standard stock box sizes that approximate the right size, reduces both shipping costs and damage-related return rates simultaneously.
Interior presentation structure in direct-to-consumer packaging affects return rates through the expectation confirmation mechanism described above. Packaging that reveals the product deliberately, through structured interior presentation rather than the product simply floating in void fill, creates a higher-quality first impression that makes customers more likely to perceive the product as meeting their expectations. This effect has been documented in consumer research across multiple product categories and is one of the arguments for interior packaging investment that goes beyond cost analysis.
Labelling and communication accuracy on the outer packaging affects a return driver that packaging analyses rarely address: purchase confusion. Customers who open a package and discover that the product inside differs from what the external labelling led them to expect return at higher rates than customers who receive exactly what the labelling described. This category of return is attributed to the product in most return management systems but is caused by a communication failure in the packaging, either through ambiguous labelling, photography that doesn’t accurately represent the enclosed product, or packaging that suggests contents other than what is enclosed.
What the Data Shows About Subscription Box Return Rates and Packaging
Subscription e-commerce provides a particularly informative dataset for packaging-return rate analysis because the same packaging is experienced repeatedly by the same customers across multiple delivery cycles, allowing the packaging’s contribution to retention and return behaviour to be isolated more clearly than in single-purchase contexts.
Subscription commerce platform data from multiple sources consistently shows that packaging quality is among the top three cited reasons for subscription cancellation, alongside product dissatisfaction and pricing. Packaging quality in this context encompasses both functional adequacy, the product arrives undamaged, and experiential quality, the unboxing experience is consistent with the subscription’s price point and brand positioning. Subscriptions whose packaging quality degrades below customer expectations, whether through packaging downgrade decisions driven by cost reduction, damage from inadequate protective specification, or presentation inconsistency between boxes, show measurably higher churn rates in the periods following the quality decline.
The reverse relationship, subscriptions that improve packaging quality, shows measurable churn reduction. A case study published in subscription commerce industry research described a beauty subscription that upgraded its mailer box from a standard kraft mailer to a branded rigid-style box with interior tissue and a printed insert, and measured a 17-percent reduction in voluntary cancellation rate in the two cycles following the upgrade. This churn reduction translated into lifetime value improvement that exceeded the cost of the packaging upgrade within three billing cycles.
How Returns Data Should Inform Packaging Specification Decisions
The practical application of returns data to packaging specification decisions requires building the connection between the two datasets in a way that most e-commerce operations don’t currently maintain.
Standard e-commerce analytics tracks return rate as a product-level metric and packaging cost as a procurement metric, with no systematic connection between them. This disconnection means that a packaging cost reduction that generates a return rate increase appears in two separate analyses as an independent improvement and an independent problem, rather than as a connected decision with a calculable net effect. Building the analytical connection between packaging specification, packaging cost, and return rate across the same product cohort produces the data needed to evaluate packaging decisions as cost-return rate trade-offs rather than as pure cost decisions.
The analysis framework that produces actionable results compares return rates across the same product sold with different packaging specifications, either over time when packaging changes, or across different fulfilment channels using different packaging. A product whose return rate increased from 4 percent to 7 percent following a packaging specification downgrade provides a 3-percentage-point return rate difference that can be converted into a dollar cost using the per-return cost figure relevant to the operation, producing an estimate of what the packaging downgrade is costing in additional returns that can be compared against the packaging cost saving that motivated the change.
The analysis rarely shows that premium packaging always justifies itself through return rate reduction alone. It shows that packaging specification decisions below the threshold of adequate protection and appropriate presentation generate return rate increases that exceed their cost savings, while packaging specification decisions above the threshold of adequate protection and appropriate presentation produce diminishing return rate benefits relative to increasing packaging costs. The commercially optimal packaging specification sits at the point where further investment produces progressively smaller return rate reductions, and identifying that point requires data that most e-commerce operations are positioned to collect but don’t currently organise in a way that makes the analysis possible.
